Reports: Footprint Report
Footprints enable users to gather a quick understanding of the combined coverage for all locations within a Network. Users can produce a served market footprint on a select few locations or the entire Network.
Through using a Footprint Report users can also calculate if a Passive Network’s locations whether it falls within the Footprint of the Active Network. This can help identify nearby locations of interest to a Network or categorise locations within a geographic common Network.
Create Footprint Report


Open Network to perform the Footprint Report on.
Click “Create Reports” then “Footprint”.
Follow the on-screen instructions to set the Report details:
Title Report: To identify the Report from the Report Library later. (This can be edited inside the Report and Report Library)
Choose Number of Footprints: Choose number of Footprints to create (for Market sizing and use of “Inside Footprint Analysis” users should only use one Footprint).
Select Locations by Tags: Filter for Tags necessary to the analysis, users can select “All” or “Any” depending on if all Tags selected or any Tags selected are required.
Click 'Create New Report' to generate the Report.
Report Tab
The Report Table displays the Count, Penetration and Index of the chosen Data pack Variables (rows) for each of the defined Footprints (columns) without duplication from overlapping Trade Areas.


Features
Report Sections: Select from the library of data pack variables within 'Report Sections' to display them as rows in the Table.
Display Controls: These apply to viewing data within the system and any data which is exported, and include:
Change Display: If there is more than one Footprint, users have the option to change Display to 'Count', '% / Penetration' or 'Index' Scores.
Trade Area Selection: Allows users to exclude/include the Primary, Secondary and Tertiary Trade Area in the Footprint.
Aggregation: Allows users to toggle between “Combined” and “Separate” options which determines whether the data for Trade Areas is shown together or as separate columns.
Benchmark Region: Set Benchmark Region for Index calculation. By default this is national.
Sort: Users can click on the Column header to sort values.
Map Tab


The Map Tab displays the selected Footprint Location Trade Areas, and provides a visual representation of the Footprint. The Footprint can be used to filter and identify a Passive Network’s Locations that fall inside or outside a Footprint.
Features: Display Passive Networks
Users can use Passive Networks to perform two functions; Proximity Analysis Filter and Inside Footprint Analysis. To select a passive network;
Check on “Display Passive Network”
Select “Passive Network #1” drop down
Choose a network by clicking on the “Select a Network”
Proximity Analysis Filter
This will filter Passive Network Locations based on their proximity to Active Network Locations (this can also be done in Network mode, see more here), to do this:
Select “Proximity Analysis” drop down.
Enter a value for the distance Passive Network Locations need to be within Active Network Locations.
Optional - Check on “Invert Selection” to invert the selected locations from Step 2 (This ensures the passive locations fall outside the Footprint by the entered distance).
Optional - Click “Export Location Proximity List” to download a list of the distances between all passive and active locations based on the applied proximity filter.
Optional - Click “Save Selection as New Network” to create the filtered Passive Network Locations as a new network.
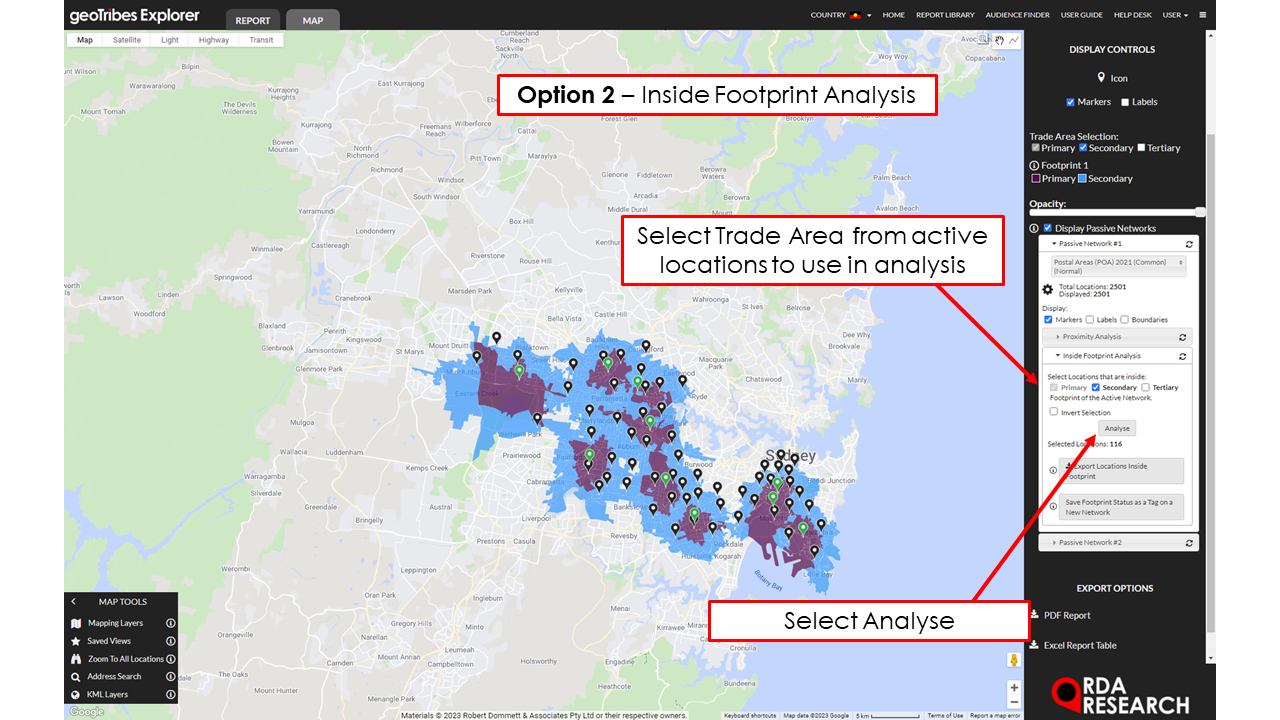
Inside Footprint Analysis Filter
This will filter the Passive Network Locations depending on if they are inside or outside the defined Trade Areas of the Footprint (Primary, Secondary and/or Tertiary), to do this:
Select “Inside Footprint Analysis”.
Choose which Trade Areas of the Active Networks will be used to filter the Passive Network Locations.
Optional - Check on “Invert Selection” to invert selected locations from Step 2 (This ensures the passive locations fall outside the defined Trade Areas of the Footprint).
Select “Analyse”.
Optional - Click “Export Locations Inside Footprint” to download a list of the distances between all passive and active locations based on the applied Inside Footprint filter.
Optional - Click “Save Footprint Status as a Tag on a New Network” to create the filtered Passive Network Locations as a new network. Users have two options in creating this new Network:
Save Inside Footprints Selection Only - Checking this option will save the Passive Locations that lie within the Footprint of the Active network.
Include Active Network Locations as Tag - Checking this option will add extra Location Tags to the new Network, which includes the Active Location Name and Trade Area within which the filtered Passive Network location lies.
Export
There are a range of options within the Report Menu for exporting the Data within the Report. These include:
'PDF Report' creates a PDF document matching the Report Table, which can be either downloaded or sent as an email.
'Excel Report Table' downloads an Excel spreadsheet based on user selection of data packs.
'KML of Areas' downloads a KML Mapping Layer of the Footprints.
